【Python】2 examples of Chebyshev inequality
🗓 2017年08月04日 📁 文章归类: 趣文
版权声明:本文作者是郭飞。转载随意,标明原文链接即可。
原文链接:https://www.guofei.site/2017/08/04/pythonchebyshev.html
About the theory of Chebyshev inequality, see law of large numbers.
2 examples
This blog gives 2 examples of Chebyshev inequality: standard norm distribution, student’s t-distribution.
chebyshev
Here are two forms of Chebyshev inequality:
chebyshev1
$Pr[\mid X-u \mid \geq s] \leq \dfrac{\sigma^2}{s^2}$
If the p.d.f is an even function ( meaning u=0 ),
$Pr[ X-u \geq s] \leq \dfrac{\sigma^2}{2s^2}$
chebyshev2
(also known as Cantelli’s inequality)
$Pr[ X-u \geq s] \leq \dfrac{\sigma^2}{s^2+\sigma^2}$
let $u=0,\sigma^2=1$
def chebyshev1(u,sigma,s):
    return sigma**2/s**2

def chebyshev2(u,sigma,s):
    return sigma**2/(sigma**2+s**2)

import numpy as np
u=0;sigma=1;

chebylist1=[]
chebylist2=[]
xlist=np.arange(0.5,5,0.01)
for s in xlist:
    #min(chebyshev1(u,sigma,s)/2,chebyshev2(u,sigma,s))
    chebylist1.append(chebyshev1(u,sigma,s)/2)
    chebylist2.append(chebyshev2(u,sigma,s))


from scipy.stats import norm
normlist=norm.sf(xlist)

from scipy.stats import t
tlist=t.sf(xlist,df=2)

import matplotlib.pyplot as plt
plt.plot(xlist,chebylist1)
plt.plot(xlist,chebylist2)
plt.plot(xlist,normlist)
plt.plot(xlist,tlist)
plt.legend(['chebyshev inequality 1','chebyshev inequality 2','norm distribution equality','t-distribution equality'])
plt.show()
output:
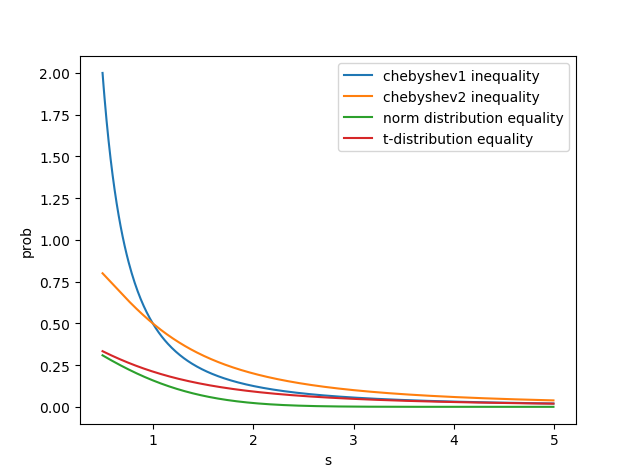
The graph tells us the accuracy of the Chebysheve inequality.
您的支持将鼓励我继续创作!