【matplotlib】设置
🗓 2017年09月20日 📁 文章归类: 0x70_可视化
版权声明:本文作者是郭飞。转载随意,标明原文链接即可。
原文链接:https://www.guofei.site/2017/09/20/matplotlib.html
matplotlib.rcParams
<class ‘matplotlib.RcParams’> , 可以像 dict 那样操作
存放了基本配置,这里拣选一部分进行说明:
| 变量 | 意义 |
|---|---|
| savefig.dpi | 点击工具栏里save进行保存时的dpi |
| savefig.directory | 点击工具栏里save进行保存时的默认目录 |
例如:
import matplotlib
matplotlib.rcParams['savefig.dpi']=4
plt.rcParams['figure.figsize'] = (20.0, 12.0) # 图片大小
plt.rcParams['figure.dpi'] = 200 # jupyter中调大dpi可以让图更大,同时不会模糊

plt.rcParams['savefig.dpi'] = 100

plt.rcParams['font.sans-serif'] = ['SimHei'] # 中文支持
plt.rcParams['axes.unicode_minus'] = False # 解决中文支持时,负号为方块的问题
保存已经plot过的图像:
plt.savefig('test.png',dpi=120)  # 自动根据扩展名推断文件类型,svg,png,pdf等
plt.savefig('a.svg') # 保持为 svg
多图表&多子图
import matplotlib.pyplot as plt
import numpy as np

x = np.linspace(0, 10, 10)

f1 = plt.figure(1)

# 第一种多子图的方法,
ax1_211 = f1.add_subplot(221)
ax1_212 = f1.add_subplot(223)
ax1_122 = f1.add_subplot(122)

ax1_211.plot(x, np.sin(x))
ax1_212.plot(x, np.cos(x))
ax1_122.plot(x, x)

f2 = plt.figure(2)
# 第二种多子图的方法
axes2 = f2.subplots(nrows=2, ncols=1, sharex=True, sharey=False)

axes2[0].plot(x, x)
axes2[1].plot(x, np.sin(x))

plt.show()
字体支持
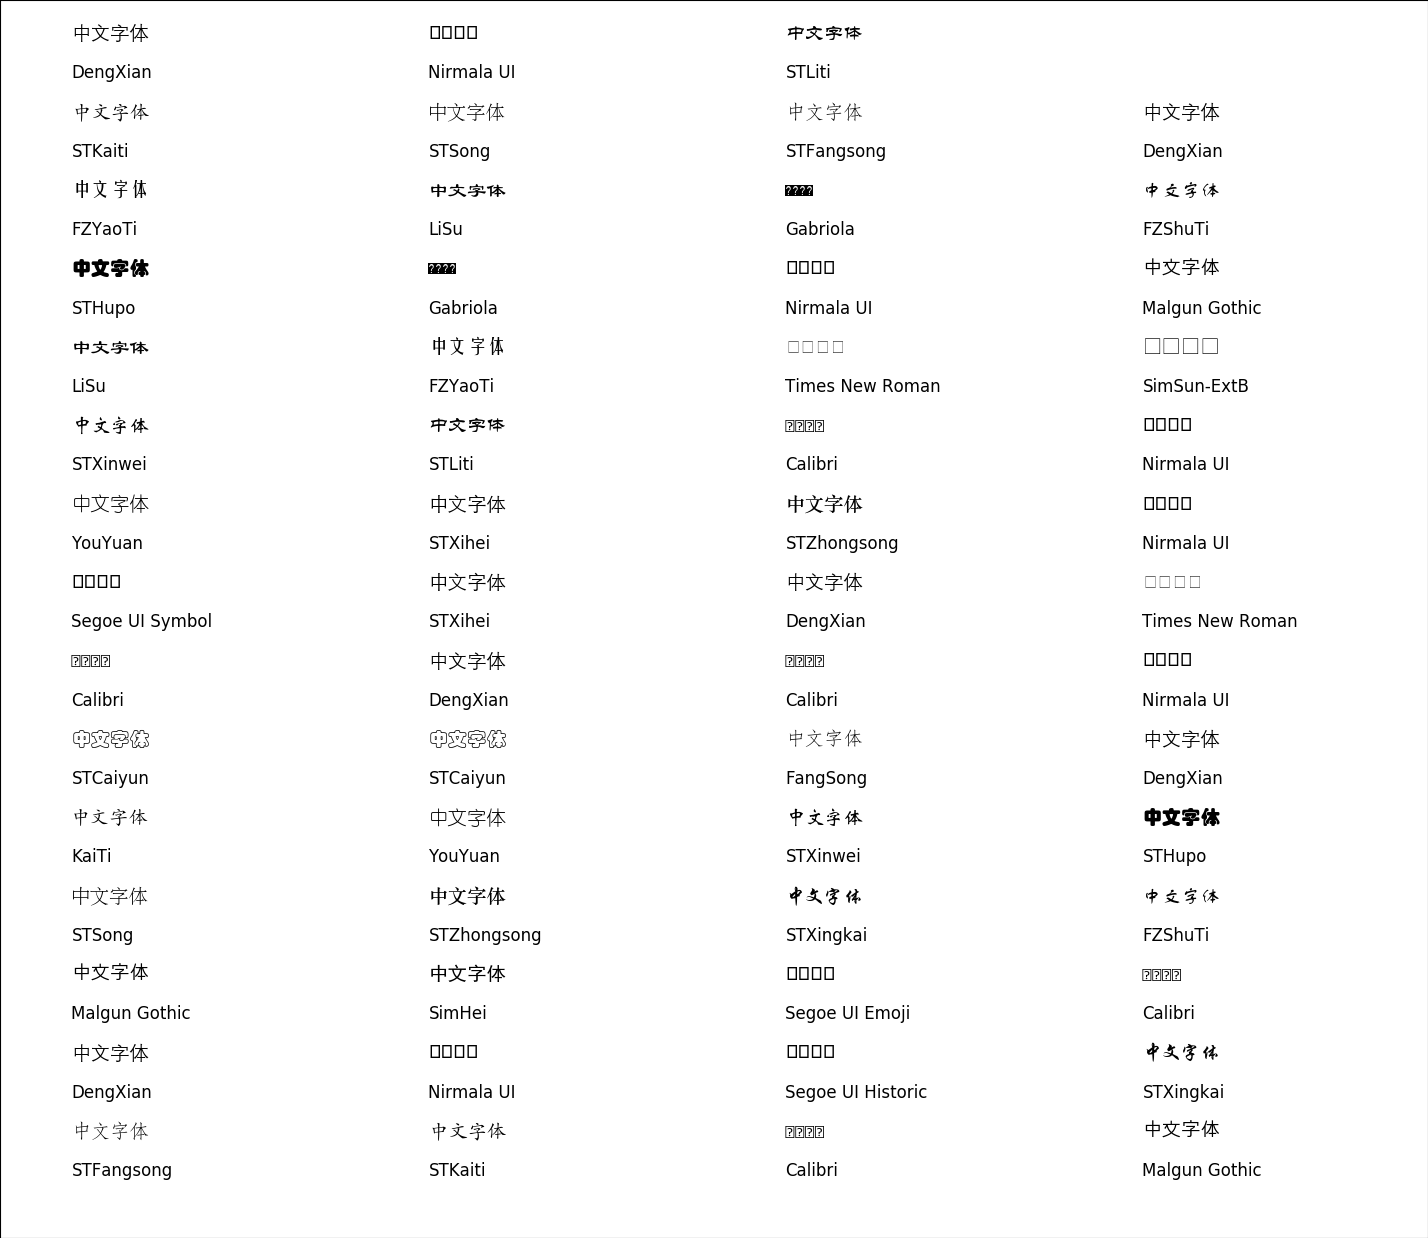
- 查询系统自带的字体
from matplotlib.font_manager import fontManager fontManager.ttflist - 系统自带字体的展示
import os
from os import path
from matplotlib.font_manager import fontManager
import matplotlib.pyplot as plt
fig=plt.figure(figsize=(8,7))
ax=fig.add_subplot(111)
plt.subplots_adjust(0,0,1,1,0,0)  #left,bottom,right,top,wspace, hspace
plt.xticks([])
plt.yticks([])
x,y=0.05,0.05
fonts = [font.name for font in fontManager.ttflist if path.exists(font.fname) and os.stat(font.fname).st_size>1e6]
font = set(fonts)
dy = (1.0 - y) / (len(fonts) // 4 + (len(fonts)%4 != 0))

for font in fonts:
    t = ax.text(x, y + dy / 2, "中文字体",{'fontname':font, 'fontsize':14}, transform=ax.transAxes)
    ax.text(x, y, font, {'fontsize':12}, transform=ax.transAxes)
    x += 0.25
    if x >= 1.0:
        y += dy
        x = 0.05
plt.show()
我找了一个字体,可以方便下载使用
import pooch

# 下载字体(画图用)
pooch.retrieve(
    url='https://www.guofei.site/datasets/fonts/SourceHanSansSC-Regular.otf',
    fname='SourceHanSansSC-Regular.otf', path='.')

import matplotlib.pyplot as plt
import matplotlib.font_manager as fm
import os

font_file = 'SourceHanSansSC-Regular.otf'

# 设置中文字符串
chinese_texts = [
    "你好,世界!",
    "测试中文显示",
    "1234567890",
    "ABCDEFGHIJ",
    "特殊符号:@#$%^&*()",
]

# 加载字体
font_prop = fm.FontProperties(fname=font_file)
print(f"字体名称: {font_prop.get_name()}")
print(f"字体家族: {font_prop.get_family()}")

# 创建测试图表
print("\n创建测试图表...")

# 创建一个图形
fig, ax = plt.subplots(1, 1, figsize=(10, 8))

# 设置标题
ax.set_title('字体测试', fontproperties=font_prop, fontsize=16, pad=20)

# 绘制文本
y_positions = range(len(chinese_texts), 0, -1)
for i, (text, y) in enumerate(zip(chinese_texts, y_positions)):
    ax.text(0.5, y, text, fontproperties=font_prop, fontsize=14, ha='center', va='center')

# 设置图表样式
ax.set_xlim(0, 1)
ax.set_ylim(0, len(chinese_texts) + 1)
ax.set_xticks([])
ax.set_yticks([])
ax.grid(True, alpha=0.3)

# 保存图表
plt.savefig("font_test.png", dpi=300, bbox_inches='tight')
print("测试图表已保存为 font_test.png")
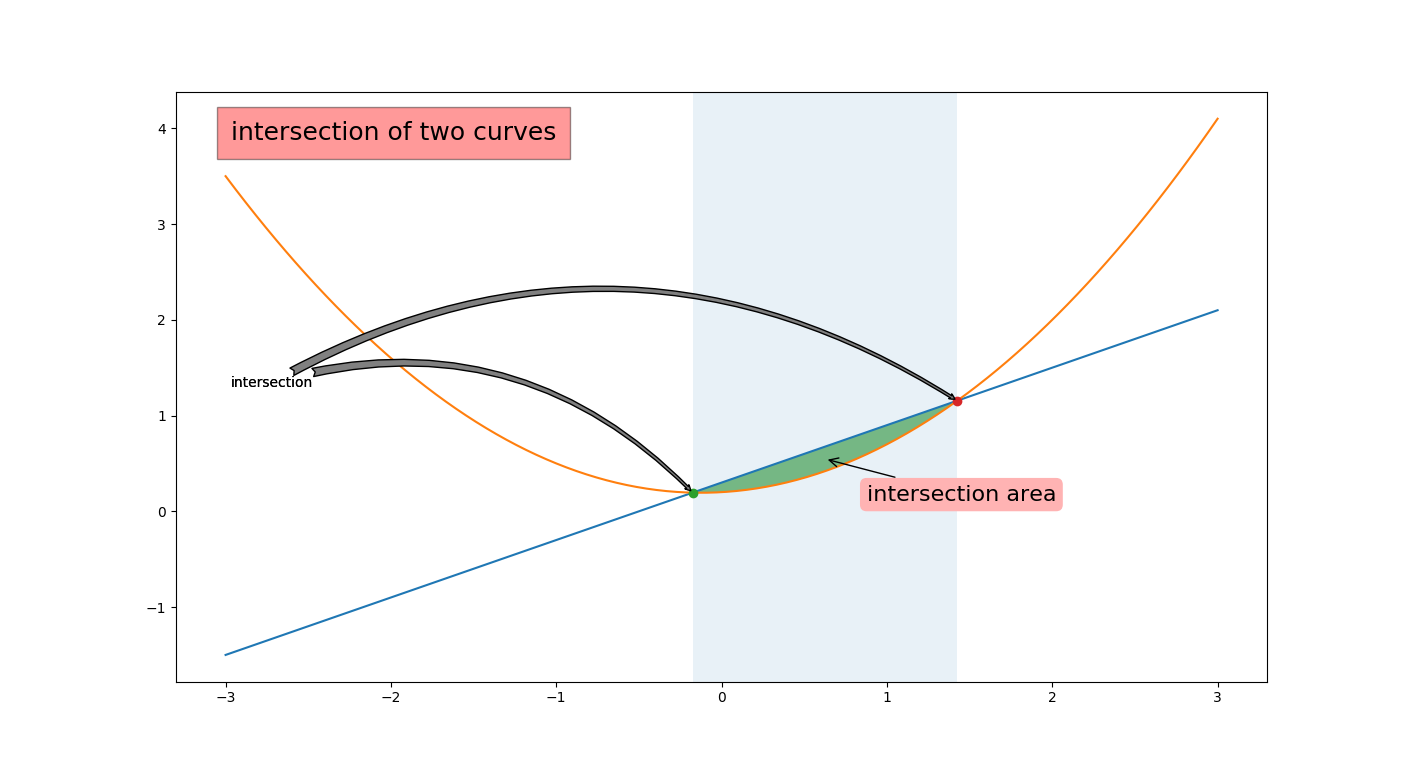
案例
import numpy as np
import matplotlib.pyplot as plt


def func1(x):
    return 0.6 * x + 0.3


def func2(x):
    return 0.4 * x * x + 0.1 * x + 0.2


def find_curve_intersects(x, y1, y2):
    d = y1 - y2
    idx = np.where(d[:-1] * d[1:] <= 0)[0]
    xl, x2 = x[idx], x[idx + 1]
    d1, d2 = d[idx], d[idx + 1]
    return -d1 * (x2 - xl) / (d2 - d1) + xl


x = np.linspace(-3, 3, 100)
f1 = func1(x)
f2 = func2(x)
fig, ax = plt.subplots(figsize=(8, 4))
ax.plot(x, f1)
ax.plot(x, f2)

x1, x2 = find_curve_intersects(x,f1, f2)
ax.plot(x1, func1(x1), "o")
ax.plot(x2, func1(x2), "o")

ax.fill_between(x, f1, f2, where=f1 > f2, facecolor='green', alpha=0.5)

from matplotlib import transforms

trans = transforms.blended_transform_factory(ax.transData, ax.transAxes)
ax.fill_between([x1, x2], 0, 1, transform=trans, alpha=0.1)

a = ax.text(0.05, 0.95, "intersection of two curves",
            transform=ax.transAxes,
            verticalalignment="top", fontsize=18,
            bbox={"facecolor": "red", "alpha": 0.4, "pad": 10}
            )

arrow = {"arrowstyle": "fancy,tail_width=0.6",
         "facecolor": "gray",
         "connectionstyle": "arc3,rad=-0.3"}

ax.annotate("intersection",
            xy=(x1, func1(x1)),
            xycoords="data",
            xytext=(0.05, 0.5),
            textcoords="axes fraction",
            arrowprops=arrow)

ax.annotate("intersection",
            xy=(x2, func1(x2)),
            xycoords="data",
            xytext=(0.05, 0.5),
            textcoords="axes fraction",
            arrowprops=arrow)

xm = (x1 + x2) / 2
ym = (func1(xm) - func2(xm)) / 2 + func2(xm)
o = ax.annotate("intersection area",
                xy=(xm, ym), xycoords="data",
                xytext=(30, -30),
                textcoords="offset points",
                bbox={"boxstyle": "round", "facecolor": (1.0, 0.7, 0.7), "edgecolor": "none"},
                fontsize=16,
                arrowprops={"arrowstyle": "->"}
                )

plt.show()
涉及知识点:
- ax.annotate(),详解见于这里
- fill_between(),看代码容易理解
- trans
您的支持将鼓励我继续创作!