【层次聚类】理论与实现
🗓 2017年09月30日 📁 文章归类: 0x32_聚类
版权声明:本文作者是郭飞。转载随意,标明原文链接即可。
原文链接:https://www.guofei.site/2017/09/30/hierachicalcluster.html
说明
层次聚类,hierarchical clustering (also called hierarchical cluster analysis or HCA )
层次聚类可以划分为两类:
- agglomerative Hierarchical clustering(AHC)自底向上,这里主要写的是这种方法
- divisive Hierarchical clustering 自顶向下,一开始所有数据为一类,每次把一个类分开,因为把类分开算法较为复杂,所以这种方法关注度不高,
AHC基本思想
step1:先让各个样本各自成一类,
step2:距离最近的两类合并成一个新类
step3:反复执行step2
step4:根据需要,或根据距离临界值(阈值)确定分类数和分类结果
特点
计算量巨大,例如,100个样本点,第一轮要计算$C_{100}^2$次,第二轮$C_{99}^2$次(如果第1轮的没出现2个相等的最小距离)
sklearn实现
1. 数据准备
import pandas as pd
import numpy as np
import matplotlib.pyplot as plt

centers = [[0, 0, 0, 8], [8, 0, 8, 0], [0, 8, 0, 0]]
columns_name = ['x1', 'x2', 'x3', 'x4']
data = pd.DataFrame()
for center in centers:
    data_temp = pd.DataFrame()
    for idx, j in enumerate(center):
        data_temp = pd.concat([data_temp, pd.DataFrame({columns_name[idx]: np.random.normal(j, size=50)})], axis=1)
    data = pd.concat([data, data_temp], ignore_index=True)

m, n = data.shape
2. 建模
k = 3  # 要聚成这么多类
from sklearn.cluster import AgglomerativeClustering #导入sklearn的层次聚类函数
model = AgglomerativeClustering(n_clusters = k, linkage = 'ward')
model.fit(data) #训练模型
AgglomerativeClustering(affinity=’euclidean’, compute_full_tree=’auto’,connectivity=None, linkage=’ward’, memory=None, n_clusters=3,pooling_func=<function mean at 0x000002848CD4B048>)
使用模型
labels = model.labels_ # 原样本所在的类
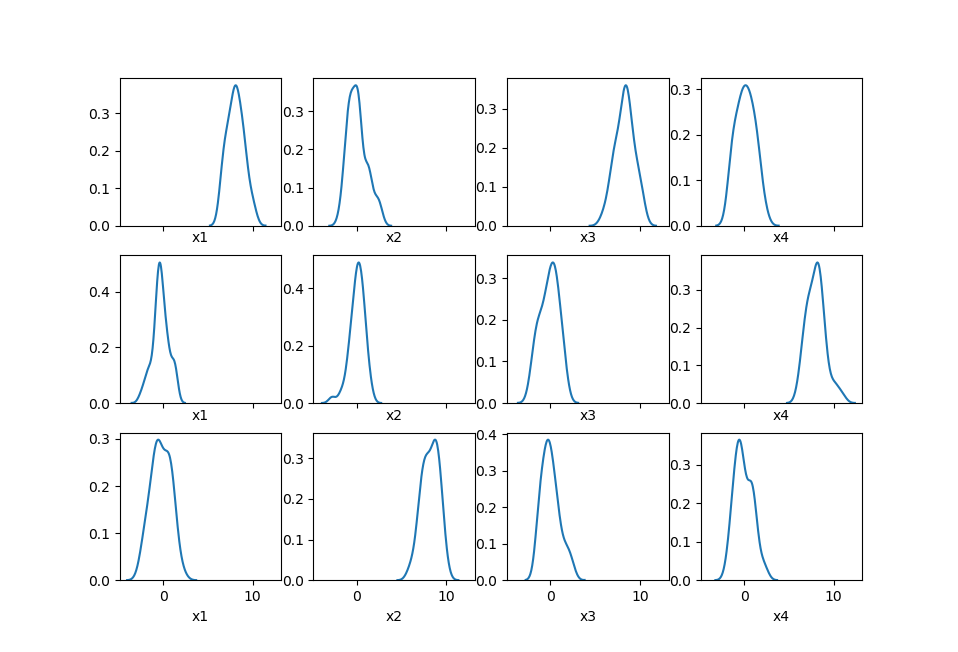
3. 可视化
import seaborn as sns
fig, ax = plt.subplots(k, n, sharex=True) # 共享x坐标的范围
for i in range(k):
for j in range(n):
sns.distplot(data.loc[labels == i, data.columns[j]], hist=False, ax=ax[i, j])
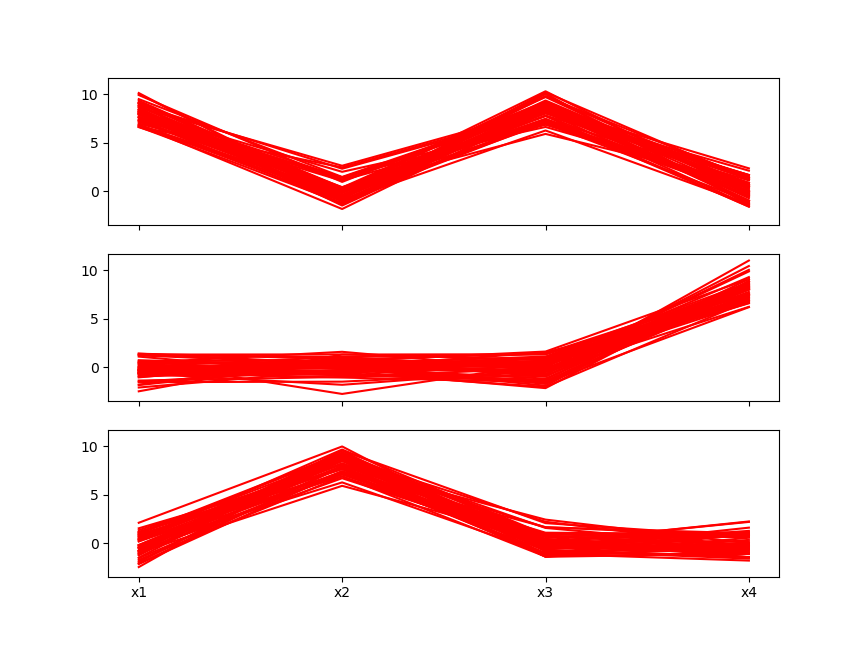
fig2, ax2 = plt.subplots(k, 1, sharex=True,sharey=True)
for i in range(k):
data_temp = data.loc[labels == i, :]
m_temp, n_temp = data_temp.shape
for j in range(m_temp):
ax2[i].plot(list(data_temp.iloc[j, :]), color='r')
plt.xticks(range(n_temp), data_temp.columns)
plt.show()
图与kmeans很像了
scipy实现
1. 数据准备
import pandas as pd
import numpy as np
import matplotlib.pyplot as plt

centers = [[0, 0, 0, 8], [8, 0, 8, 0], [0, 8, 0, 0]]
columns_name = ['x1', 'x2', 'x3', 'x4']
data = pd.DataFrame()
for center in centers:
    data_temp = pd.DataFrame()
    for idx, j in enumerate(center):
        data_temp = pd.concat([data_temp, pd.DataFrame({columns_name[idx]: np.random.normal(j, size=50)})], axis=1)
    data = pd.concat([data, data_temp], ignore_index=True)
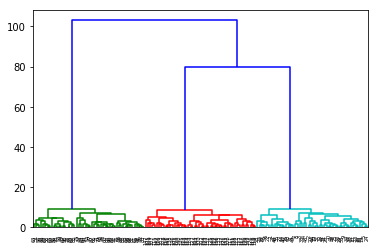
2. 建模画图
scipy可以画谱系图,sklearn没有找到方法
seaborn也可以画谱系图
注意,不要用大量数据画谱系图,如果是大量数据,请先抽样。
import matplotlib.pyplot as plt
from scipy.cluster.hierarchy import linkage,dendrogram
#这里使用scipy的层次聚类函数

Z = linkage(data, method = 'ward', metric = 'euclidean') #谱系聚类图
P = dendrogram(Z, 0) #画谱系聚类图
plt.show()
您的支持将鼓励我继续创作!