【Isomap】理论与实现
🗓 2017年12月20日 📁 文章归类: 0x31_降维
版权声明:本文作者是郭飞。转载随意,标明原文链接即可。
原文链接:https://www.guofei.site/2017/12/20/Isomap.html
简介
Isomap算法是在MDS算法的基础上衍生出的一种算法,MDS算法是保持降维后的样本间距离不变,Isomap算法引进了邻域图,样本只与其相邻的样本连接,他们之间的距离可直接计算,较远的点可通过最小路径算出距离,在此基础上进行降维保距。
from time import time
import matplotlib.pyplot as plt
from mpl_toolkits.mplot3d import Axes3D
from matplotlib.ticker import NullFormatter
from sklearn import manifold, datasets
# Next line to silence pyflakes. This import is needed.
Axes3D
n_points = 1000
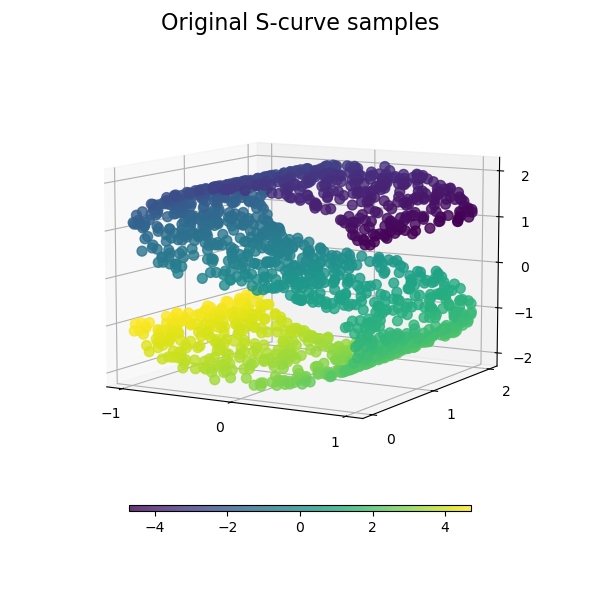
X, color = datasets.samples_generator.make_s_curve(n_points, random_state=0)
n_neighbors = 10
n_components = 2
fig = plt.figure(figsize=(15, 8))
plt.suptitle("Manifold Learning with %i points, %i neighbors"
% (1000, n_neighbors), fontsize=14)
ax = fig.add_subplot(251, projection='3d')
ax.scatter(X[:, 0], X[:, 1], X[:, 2], c=color, cmap=plt.cm.Spectral)
ax.view_init(4, -72)
methods = ['standard', 'ltsa', 'hessian', 'modified']
labels = ['LLE', 'LTSA', 'Hessian LLE', 'Modified LLE']
for i, method in enumerate(methods):
t0 = time()
Y = manifold.LocallyLinearEmbedding(n_neighbors, n_components,
eigen_solver='auto',
method=method).fit_transform(X)
t1 = time()
print("%s: %.2g sec" % (methods[i], t1 - t0))
ax = fig.add_subplot(252 + i)
plt.scatter(Y[:, 0], Y[:, 1], c=color, cmap=plt.cm.Spectral)
plt.title("%s (%.2g sec)" % (labels[i], t1 - t0))
ax.xaxis.set_major_formatter(NullFormatter())
ax.yaxis.set_major_formatter(NullFormatter())
plt.axis('tight')
t0 = time()
Y = manifold.Isomap(n_neighbors, n_components).fit_transform(X)
t1 = time()
print("Isomap: %.2g sec" % (t1 - t0))
ax = fig.add_subplot(257)
plt.scatter(Y[:, 0], Y[:, 1], c=color, cmap=plt.cm.Spectral)
plt.title("Isomap (%.2g sec)" % (t1 - t0))
ax.xaxis.set_major_formatter(NullFormatter())
ax.yaxis.set_major_formatter(NullFormatter())
plt.axis('tight')
t0 = time()
mds = manifold.MDS(n_components, max_iter=100, n_init=1)
Y = mds.fit_transform(X)
t1 = time()
print("MDS: %.2g sec" % (t1 - t0))
ax = fig.add_subplot(258)
plt.scatter(Y[:, 0], Y[:, 1], c=color, cmap=plt.cm.Spectral)
plt.title("MDS (%.2g sec)" % (t1 - t0))
ax.xaxis.set_major_formatter(NullFormatter())
ax.yaxis.set_major_formatter(NullFormatter())
plt.axis('tight')
t0 = time()
se = manifold.SpectralEmbedding(n_components=n_components,
n_neighbors=n_neighbors)
Y = se.fit_transform(X)
t1 = time()
print("SpectralEmbedding: %.2g sec" % (t1 - t0))
ax = fig.add_subplot(259)
plt.scatter(Y[:, 0], Y[:, 1], c=color, cmap=plt.cm.Spectral)
plt.title("SpectralEmbedding (%.2g sec)" % (t1 - t0))
ax.xaxis.set_major_formatter(NullFormatter())
ax.yaxis.set_major_formatter(NullFormatter())
plt.axis('tight')
t0 = time()
tsne = manifold.TSNE(n_components=n_components, init='pca', random_state=0)
Y = tsne.fit_transform(X)
t1 = time()
print("t-SNE: %.2g sec" % (t1 - t0))
ax = fig.add_subplot(2, 5, 10)
plt.scatter(Y[:, 0], Y[:, 1], c=color, cmap=plt.cm.Spectral)
plt.title("t-SNE (%.2g sec)" % (t1 - t0))
ax.xaxis.set_major_formatter(NullFormatter())
ax.yaxis.set_major_formatter(NullFormatter())
plt.axis('tight')
plt.show()
参考文献
http://blog.csdn.net/zhangweiguo_717/article/details/69802312
您的支持将鼓励我继续创作!